
Keyword
Marine Features (Australia) | Australian EEZ
113 record(s)
Type of resources
Topics
Keywords
Contact for the resource
Provided by
Formats
Update frequencies
Status
draft
-
This record describes multibeam echosounder data collected from the Marine National Facility (MNF) RV Investigator Voyage IN2020_V01, titled: “Development of William’s Ridge, Kerguelen Plateau: tectonics, hotspot magmatism, microcontinents, and Australia’s Extended Continental Shelf” between January 08 and March 06, 2020 departing from Henderson (WA) and returning back to Fremantle (WA). The Kongsberg EM122 multibeam echosounder was used to acquire seafloor bathymetry, backscatter information and watercolumn backscatter at Rig Seismic Seamount, Williams Ridge, Broken Ridge and on associated transits. The EM122 provides a 1 degree by 1 degree angular resolution. The echosounder's nominal frequency is 12 kHz. Data are stored in *.all raw format for bathymetry and backscatter and *.wcd format for watercolumn backscatter at CSIRO. There are 2164 files totalling 174 GB of raw data in this dataset. Sound velocity profiles were applied to this data during data acquisition. Bathymetry data contained in *.all format are corrected for motion and position. Tide corrections were not applied to the processed data. Processed data had outliers removed. Processed line data are available in *.gsf and ascii format, and processed bathymetry and backscatter grids in geotiff format. Additional information regarding this dataset, including information on processing streams, is contained in the GSM data acquisition and processing report. Additional data products may be available on request.
-
ESRI grid showing wave height and period using satellite derived wave data generated from the Australian Bureau of Meteorology's Wave Model (WAM). This grid has been produced by CSIRO for the National Oceans Office, as part of an ongoing commitment to natural resource planning and management through the 'National Marine Bioregionalisation' project. Data from National Geophysical Data Centre (NGDC) has been supplemented where loss of coverage has occurred in the deep ocean regions.
-
ESRI shape file showing ocean upwelling around Australia. This shape file was produced from a hand drawn map showing upwelling around Australia. The hand drawn map is a qualitative summary of published information on upwelling. The shape file has been produced by CSIRO for the National Oceans Office, as part of an ongoing commitment to natural resource planning and management through the 'National Marine Bioregionalisation' project. Data shown is qualitative.
-
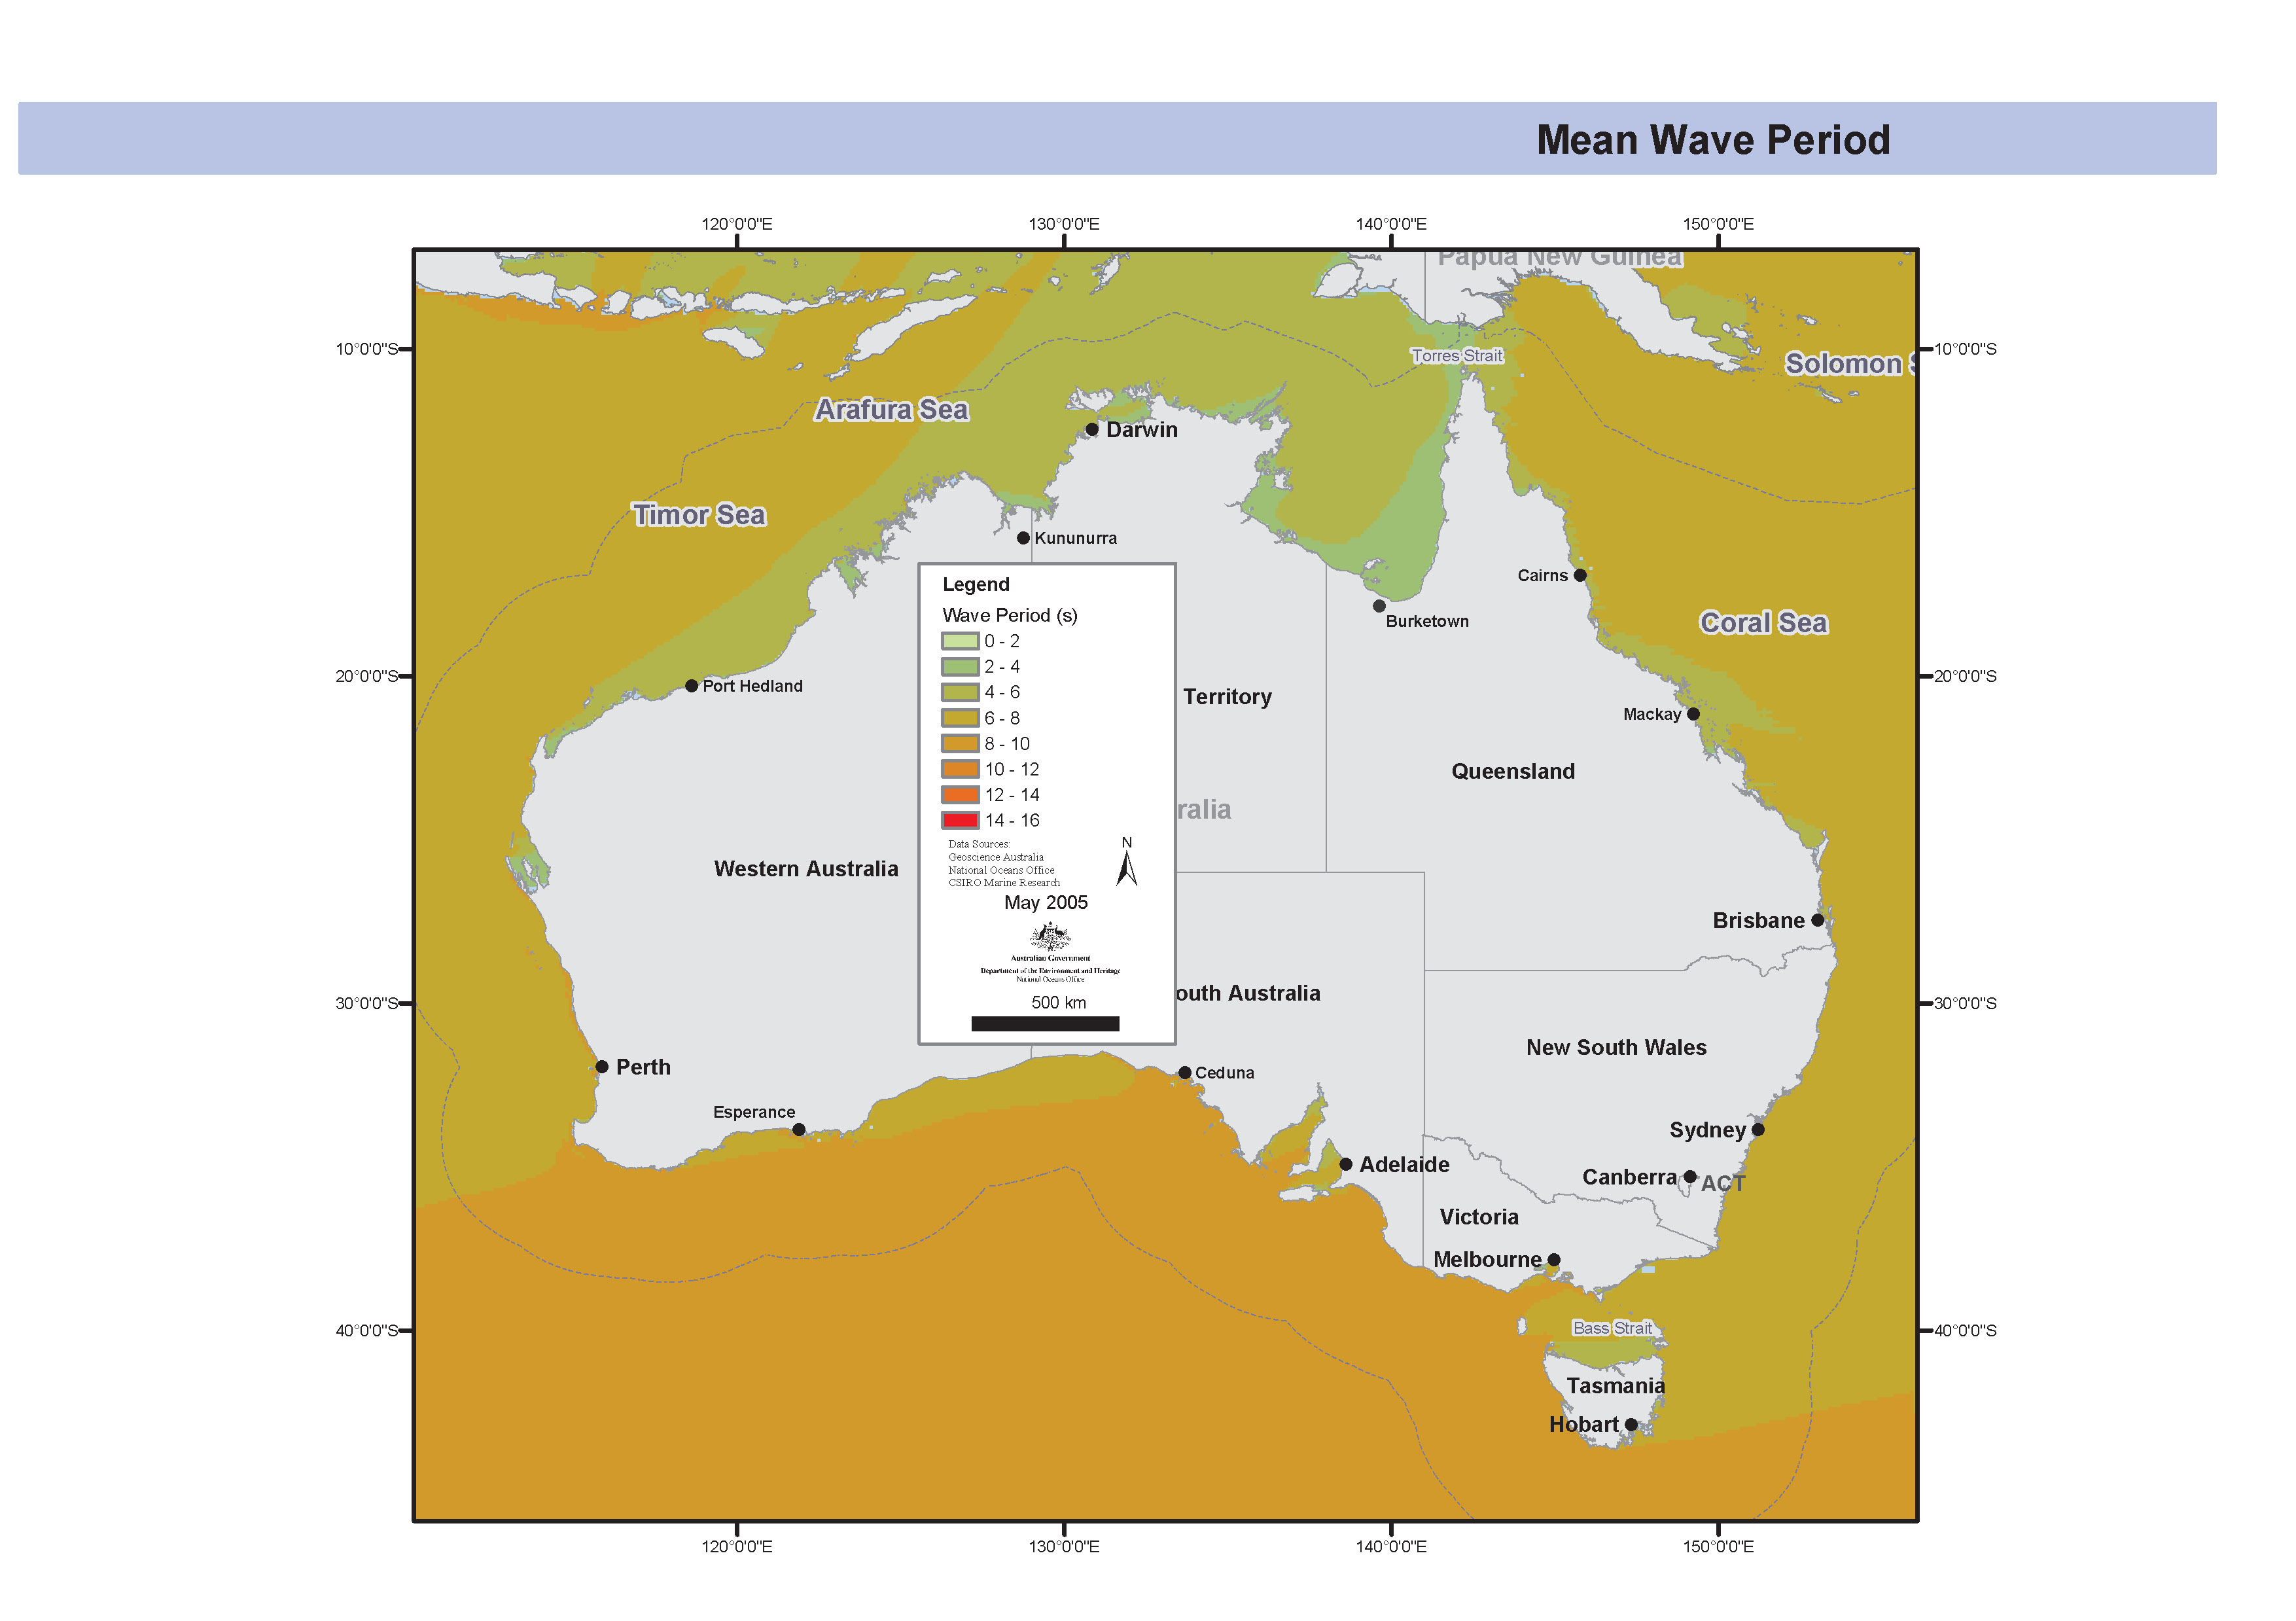
Map showing the annual mean wave period using satellite derived wave height data generated from the Australian Bureau of Meteorology's Wave Model (WAM). This map has been produced by CSIRO for the National Oceans Office, as part of an ongoing commitment to natural resource planning and management through the 'National Marine Bioregionalisation' project. Variations in onscreen colour representation or printed reproduction may affect perception of the contained data.
-
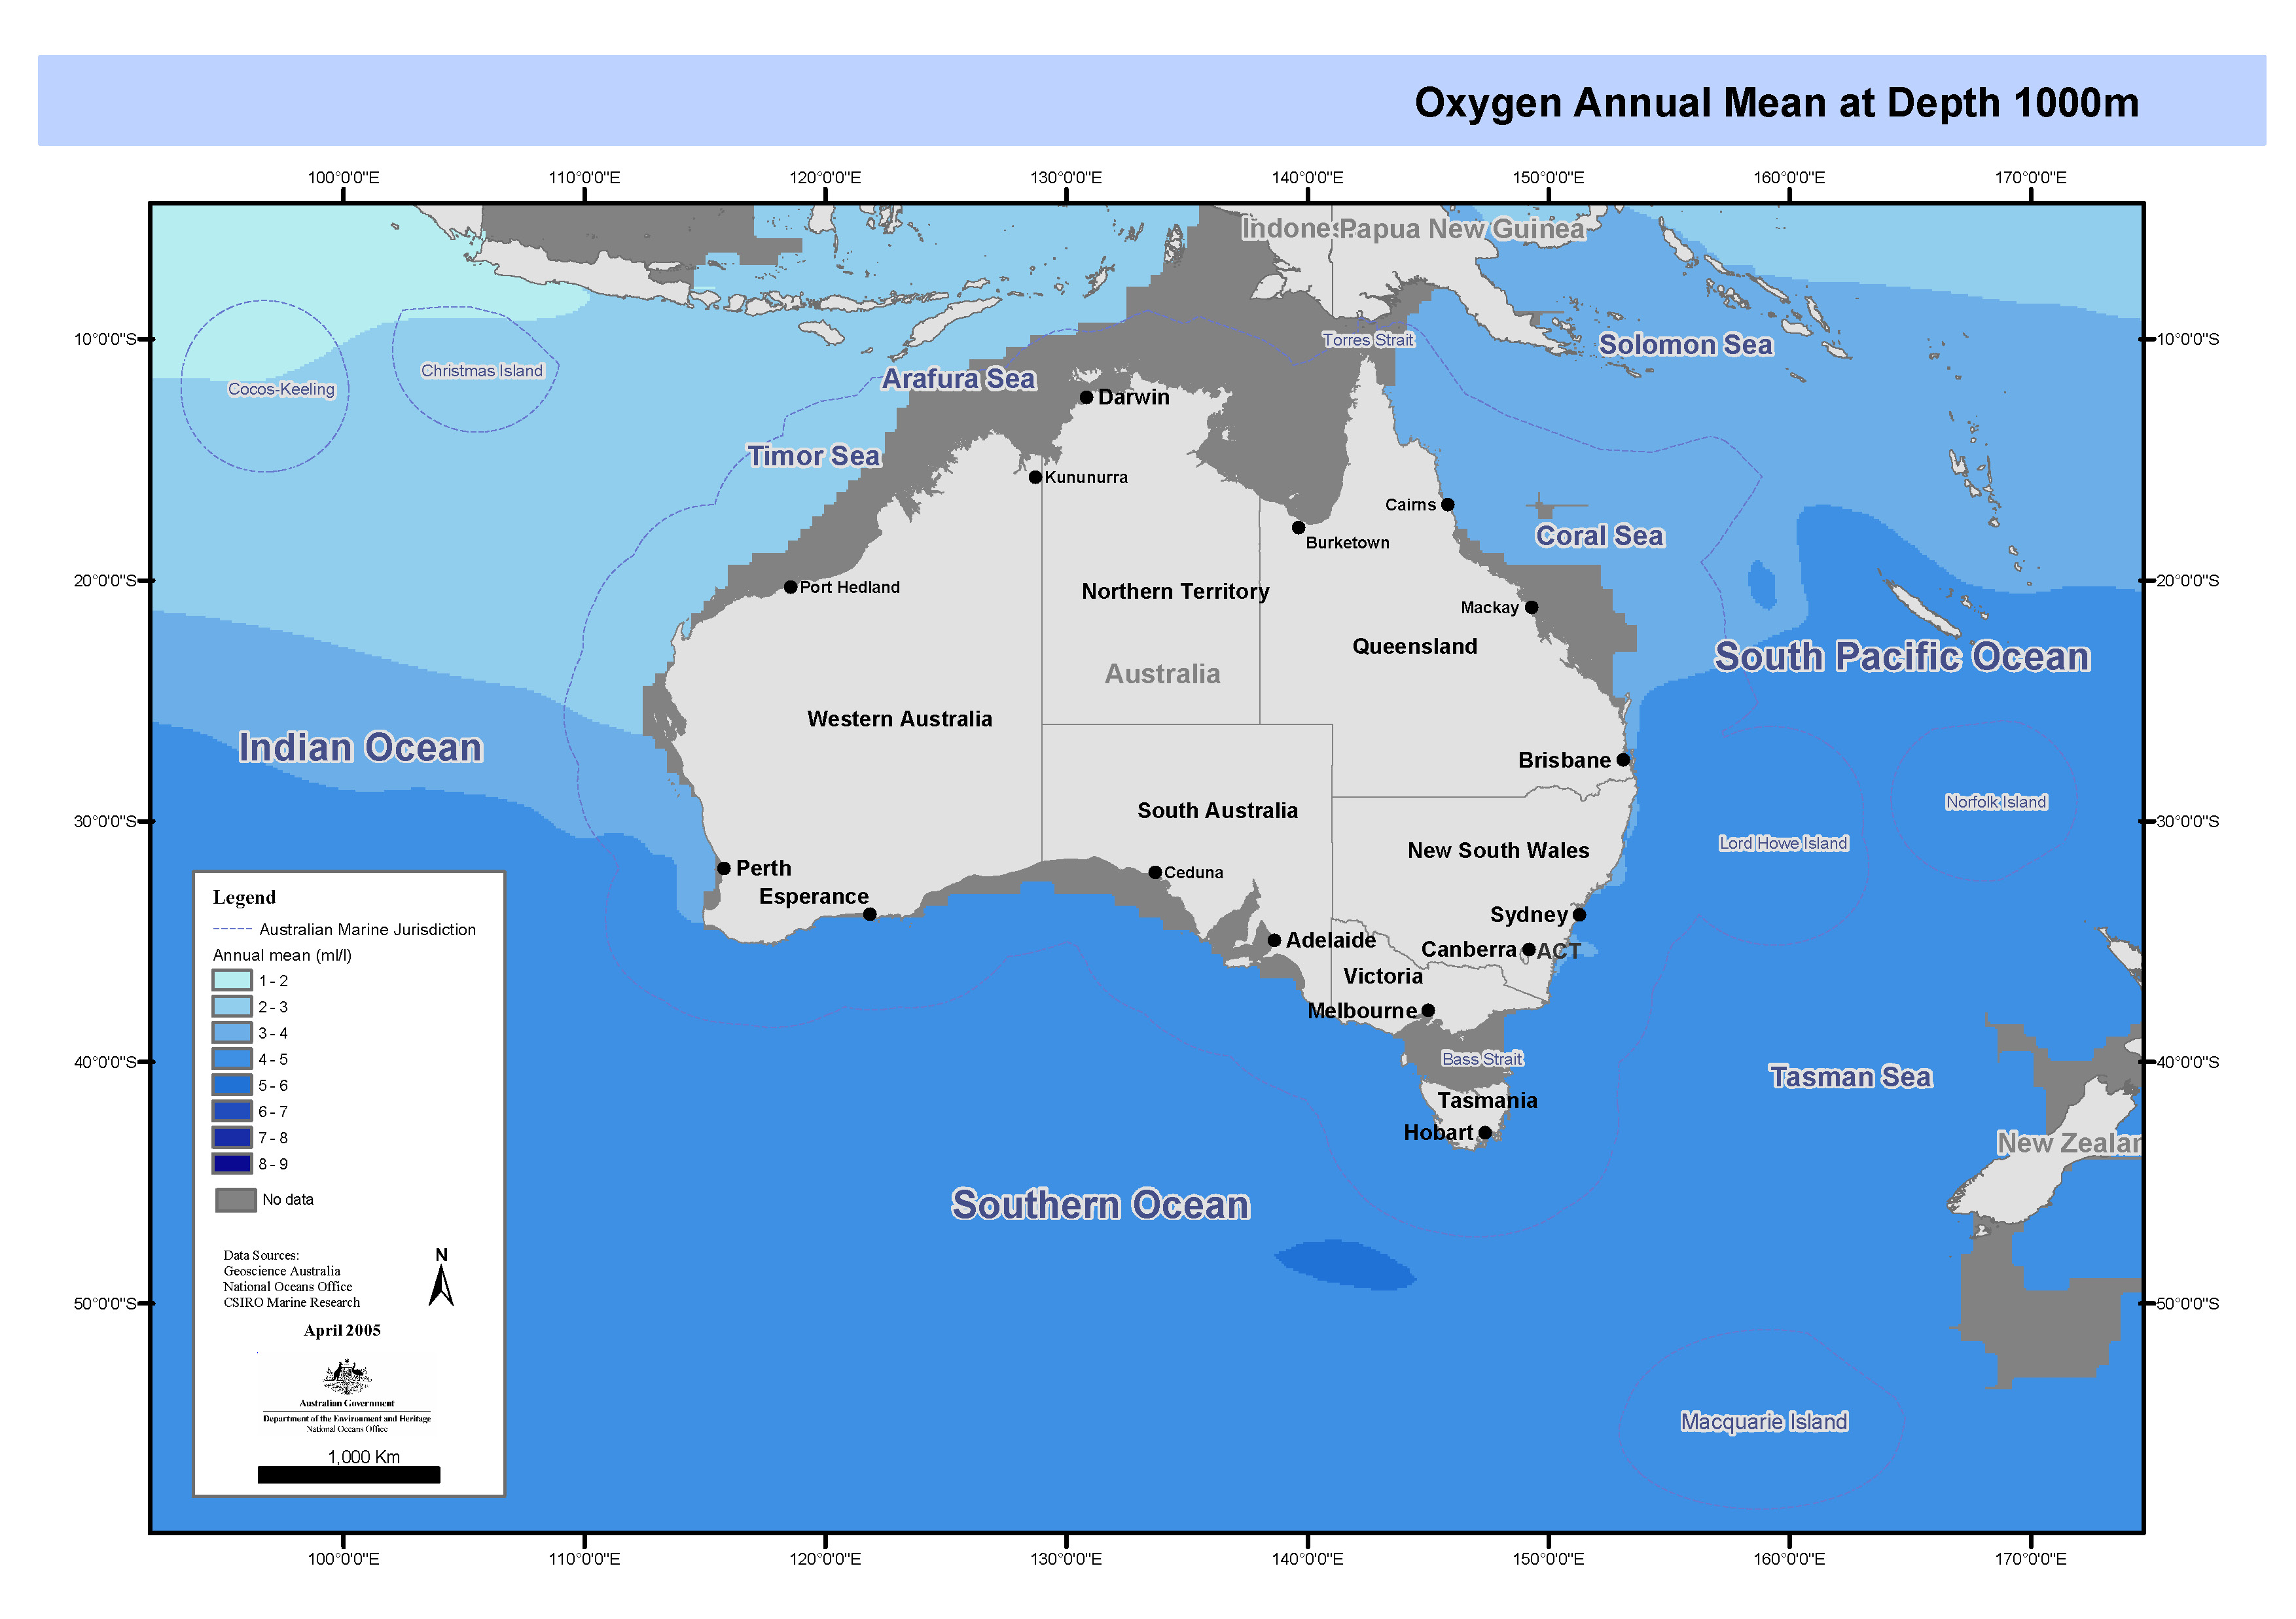
Set of maps showing dissolved oxygen by depth linearly interpolated from CARS2000 mean and seasonal fields to 0.1 degree spaced grid. These maps form part of a series of maps showing the variation of temperature, salinity, oxygen, silicate, phosphate, and nitrate in Australia's Oceans. Each feature in the series has been separately mapped at depths of 0, 150, 500, 1000 and 2000 metres. These maps have been produced by CSIRO for the National Oceans Office, as part of an ongoing commitment to natural resource planning and management through the 'National Marine Bioregionalisation' project.
-
ESRI grids showing nitrate, linearly interpolated from CARS2000 mean and seasonal fields to 0.1 degree spaced grid, at depths of 0, 150, 500, 1000 and 2000 metres. The loess filter used to create CARS2000 resolves at each point a mean value and a sinusoid with 1 year period (and in some cases a 6 month period sinusoid - the "semi-annual cycle".) The provided "annual amplitude" is simply the magnitude of that annual sinusoid. CARS is a set of seasonal maps of temperature, salinity, dissolved oxygen, nitrate, phosphate and silicate, generated using Loess mapping from all available oceanographic data in the region. It covers the region 100-200E, 50-0S, on a 0.5 degree grid, and on 56 standard depth levels. Higher resolution versions are also available for the Australian continental shelf. The data was obtained from the World Ocean Atlas 98 and CSIRO Marine and NIWA archives. It was designed to improve on the Levitus WOA98 Atlas, in the Australian region. CARS2000 is derived from ocean cast data, which is always measured above the sea floor. However, for properties which do not change rapidly near the sea floor, this would not lead to a significant error. All the limitations of CARS2000 also apply here.
-
ESRI grid showing the mean incident light for each quarter. This data is the surface solar irradiance data obtained for NASA/GISS to allow the prodction of photosynthetically active solar irradiance fields to allow the calculation of primary productio using satellite ocean colour products. The information comes from the Internation Satellite Cloud Climatology Project (ISCCP) using C1 data from multiple geostationary and polar orbiting meterological satellites to provide a global view of the occurrence and properties of clouds. Atmospheric, cloud and surface data from ICSSP are used as input along with a scheme for computing clear-sky irradiance from the solar zenith angle, air properties, and surface reflectance. The scheme then uses simple cloud properties (cloud fraction, cloud optical thickness, and diffuse albedo) to produce total and photosynthetically active solar irradiance fields (Bishop and Rossow 1991; ISCCP Documentation of Cloud Data; Frouin et al. 1989). Input and output data fields are given in a 2.5° latitude and longitude grid. These grids have been produced by CSIRO for the National Oceans Office, as part of an ongoing commitment to natural resource planning and management through the 'National Marine Bioregionalisation' project.
-
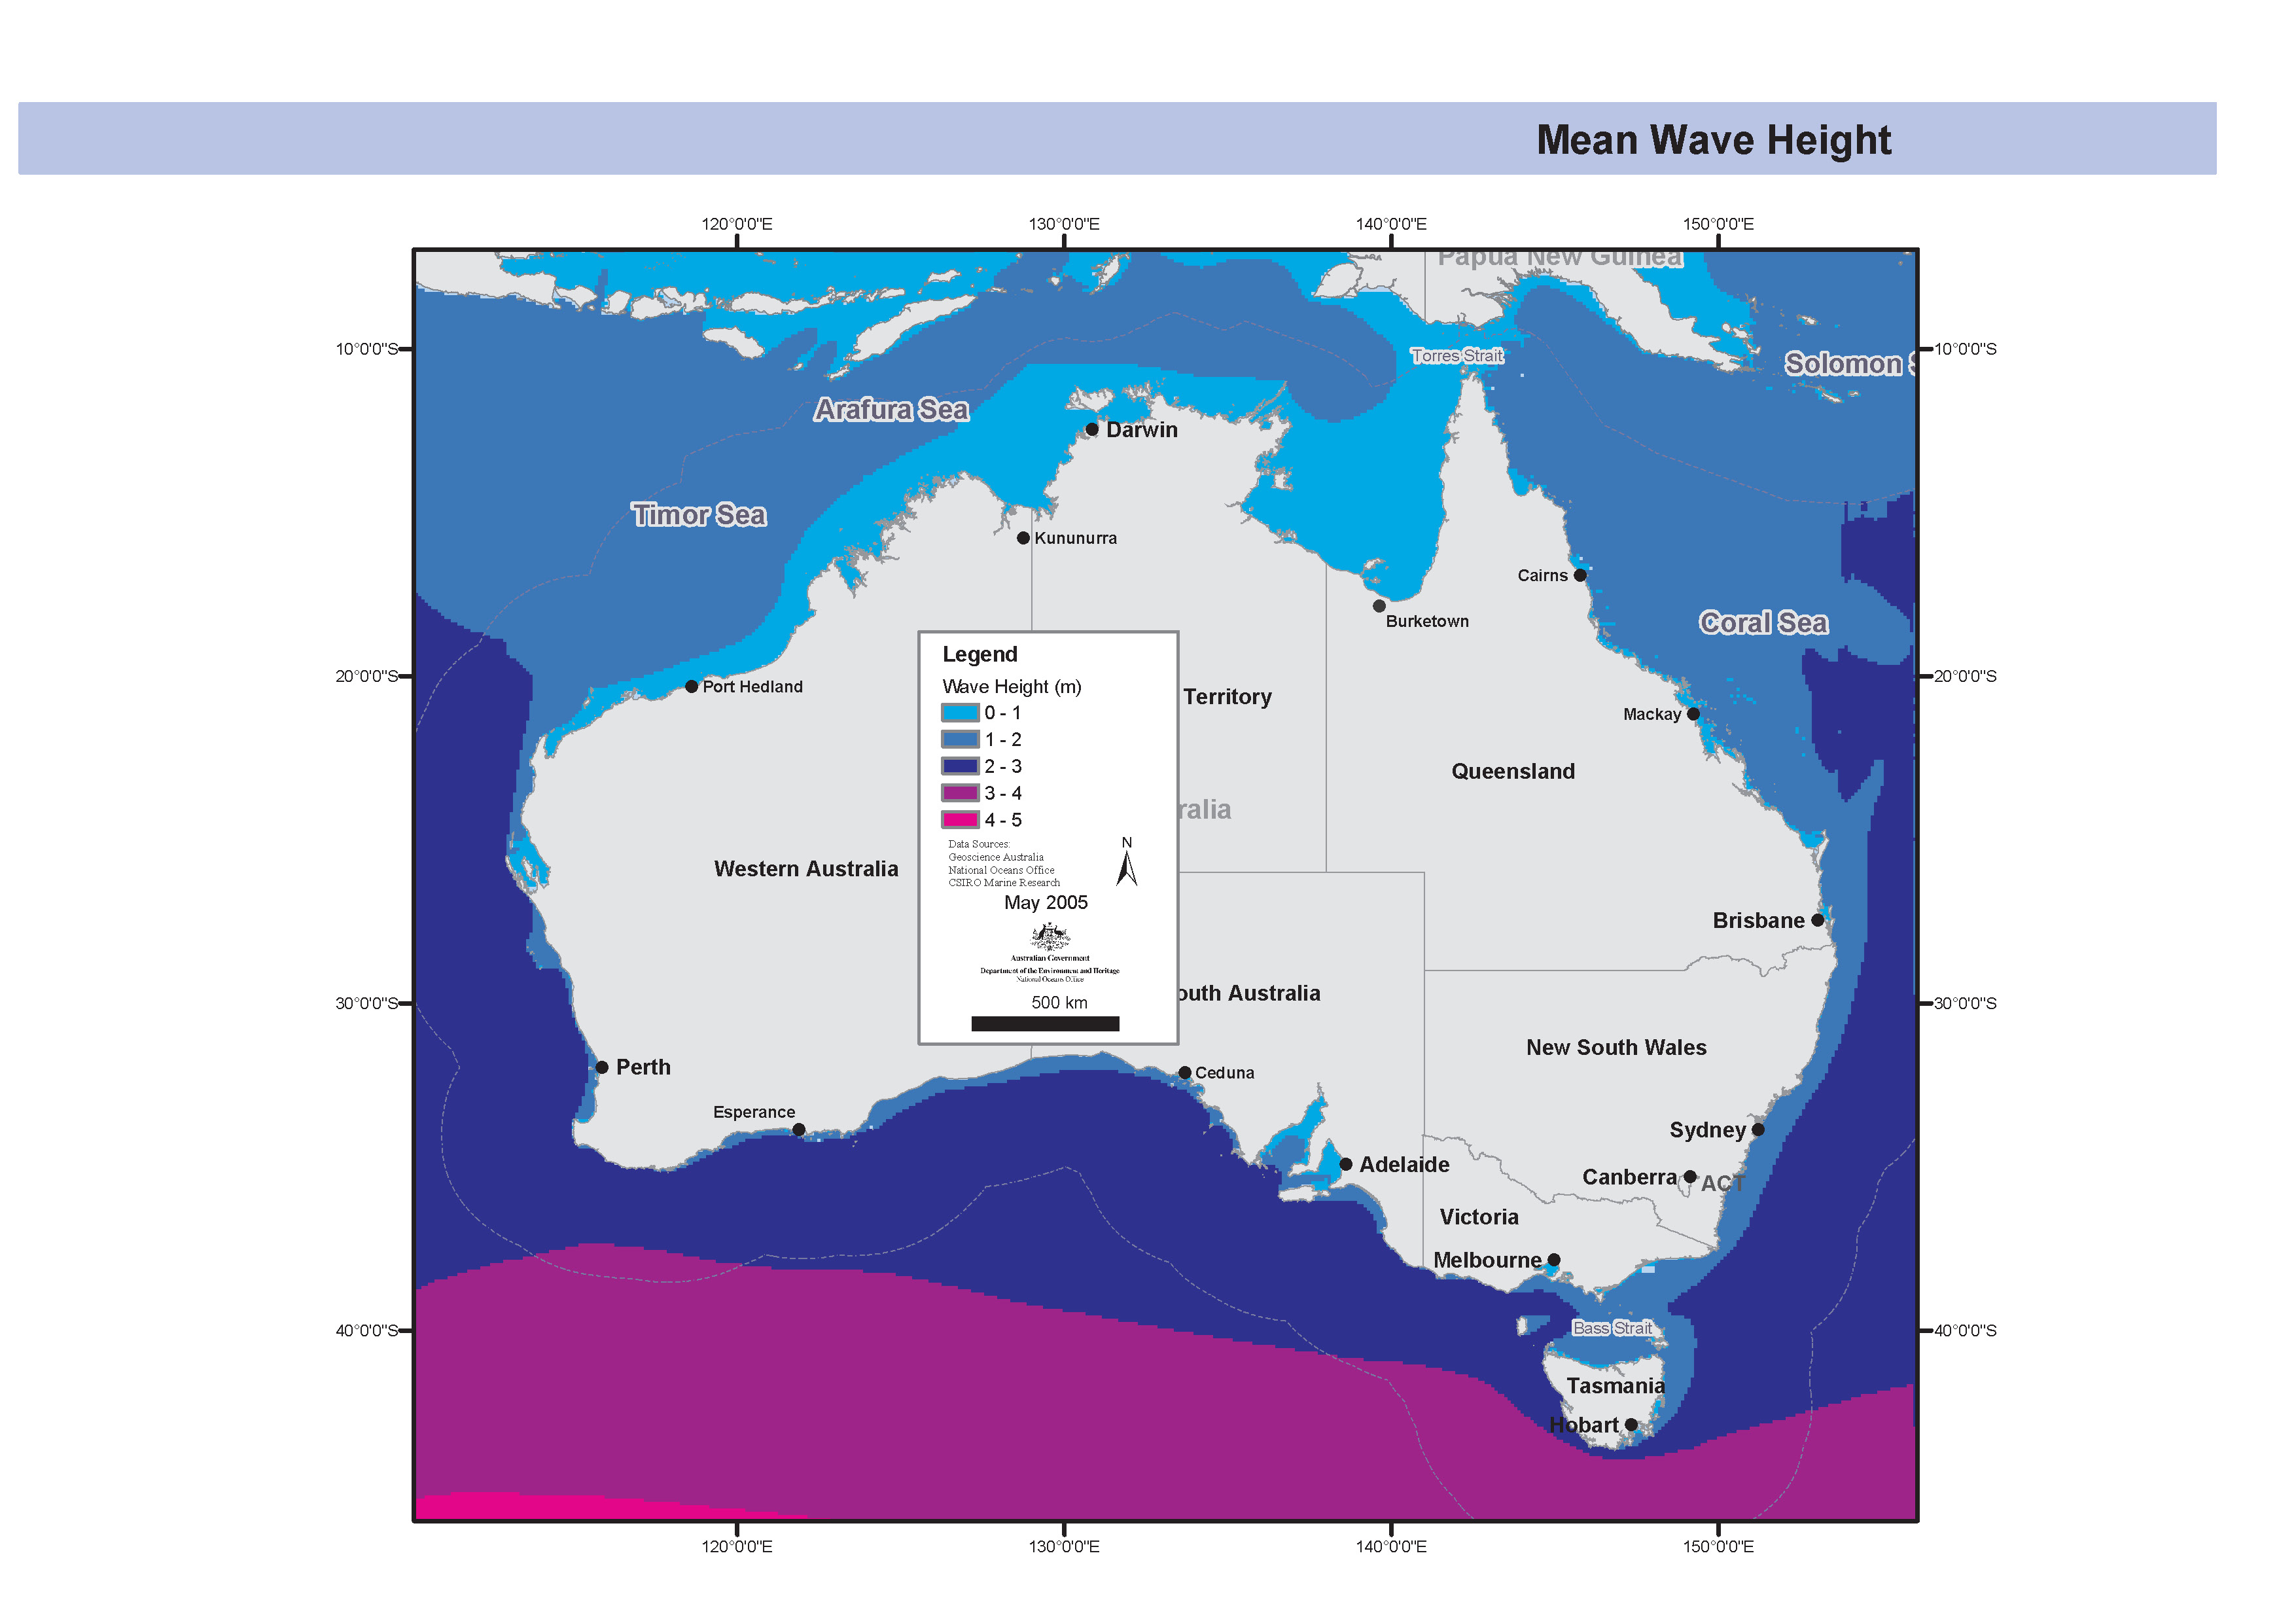
Map showing the annual mean wave height period using satellite derived wave height data generated from the Australian Bureau of Meteorology's Wave Model (WAM). This map has been produced by CSIRO for the National Oceans Office, as part of an ongoing commitment to natural resource planning and management through the 'National Marine Bioregionalisation' project. Variations in onscreen colour representation or printed reproduction may affect perception of the contained data.
-
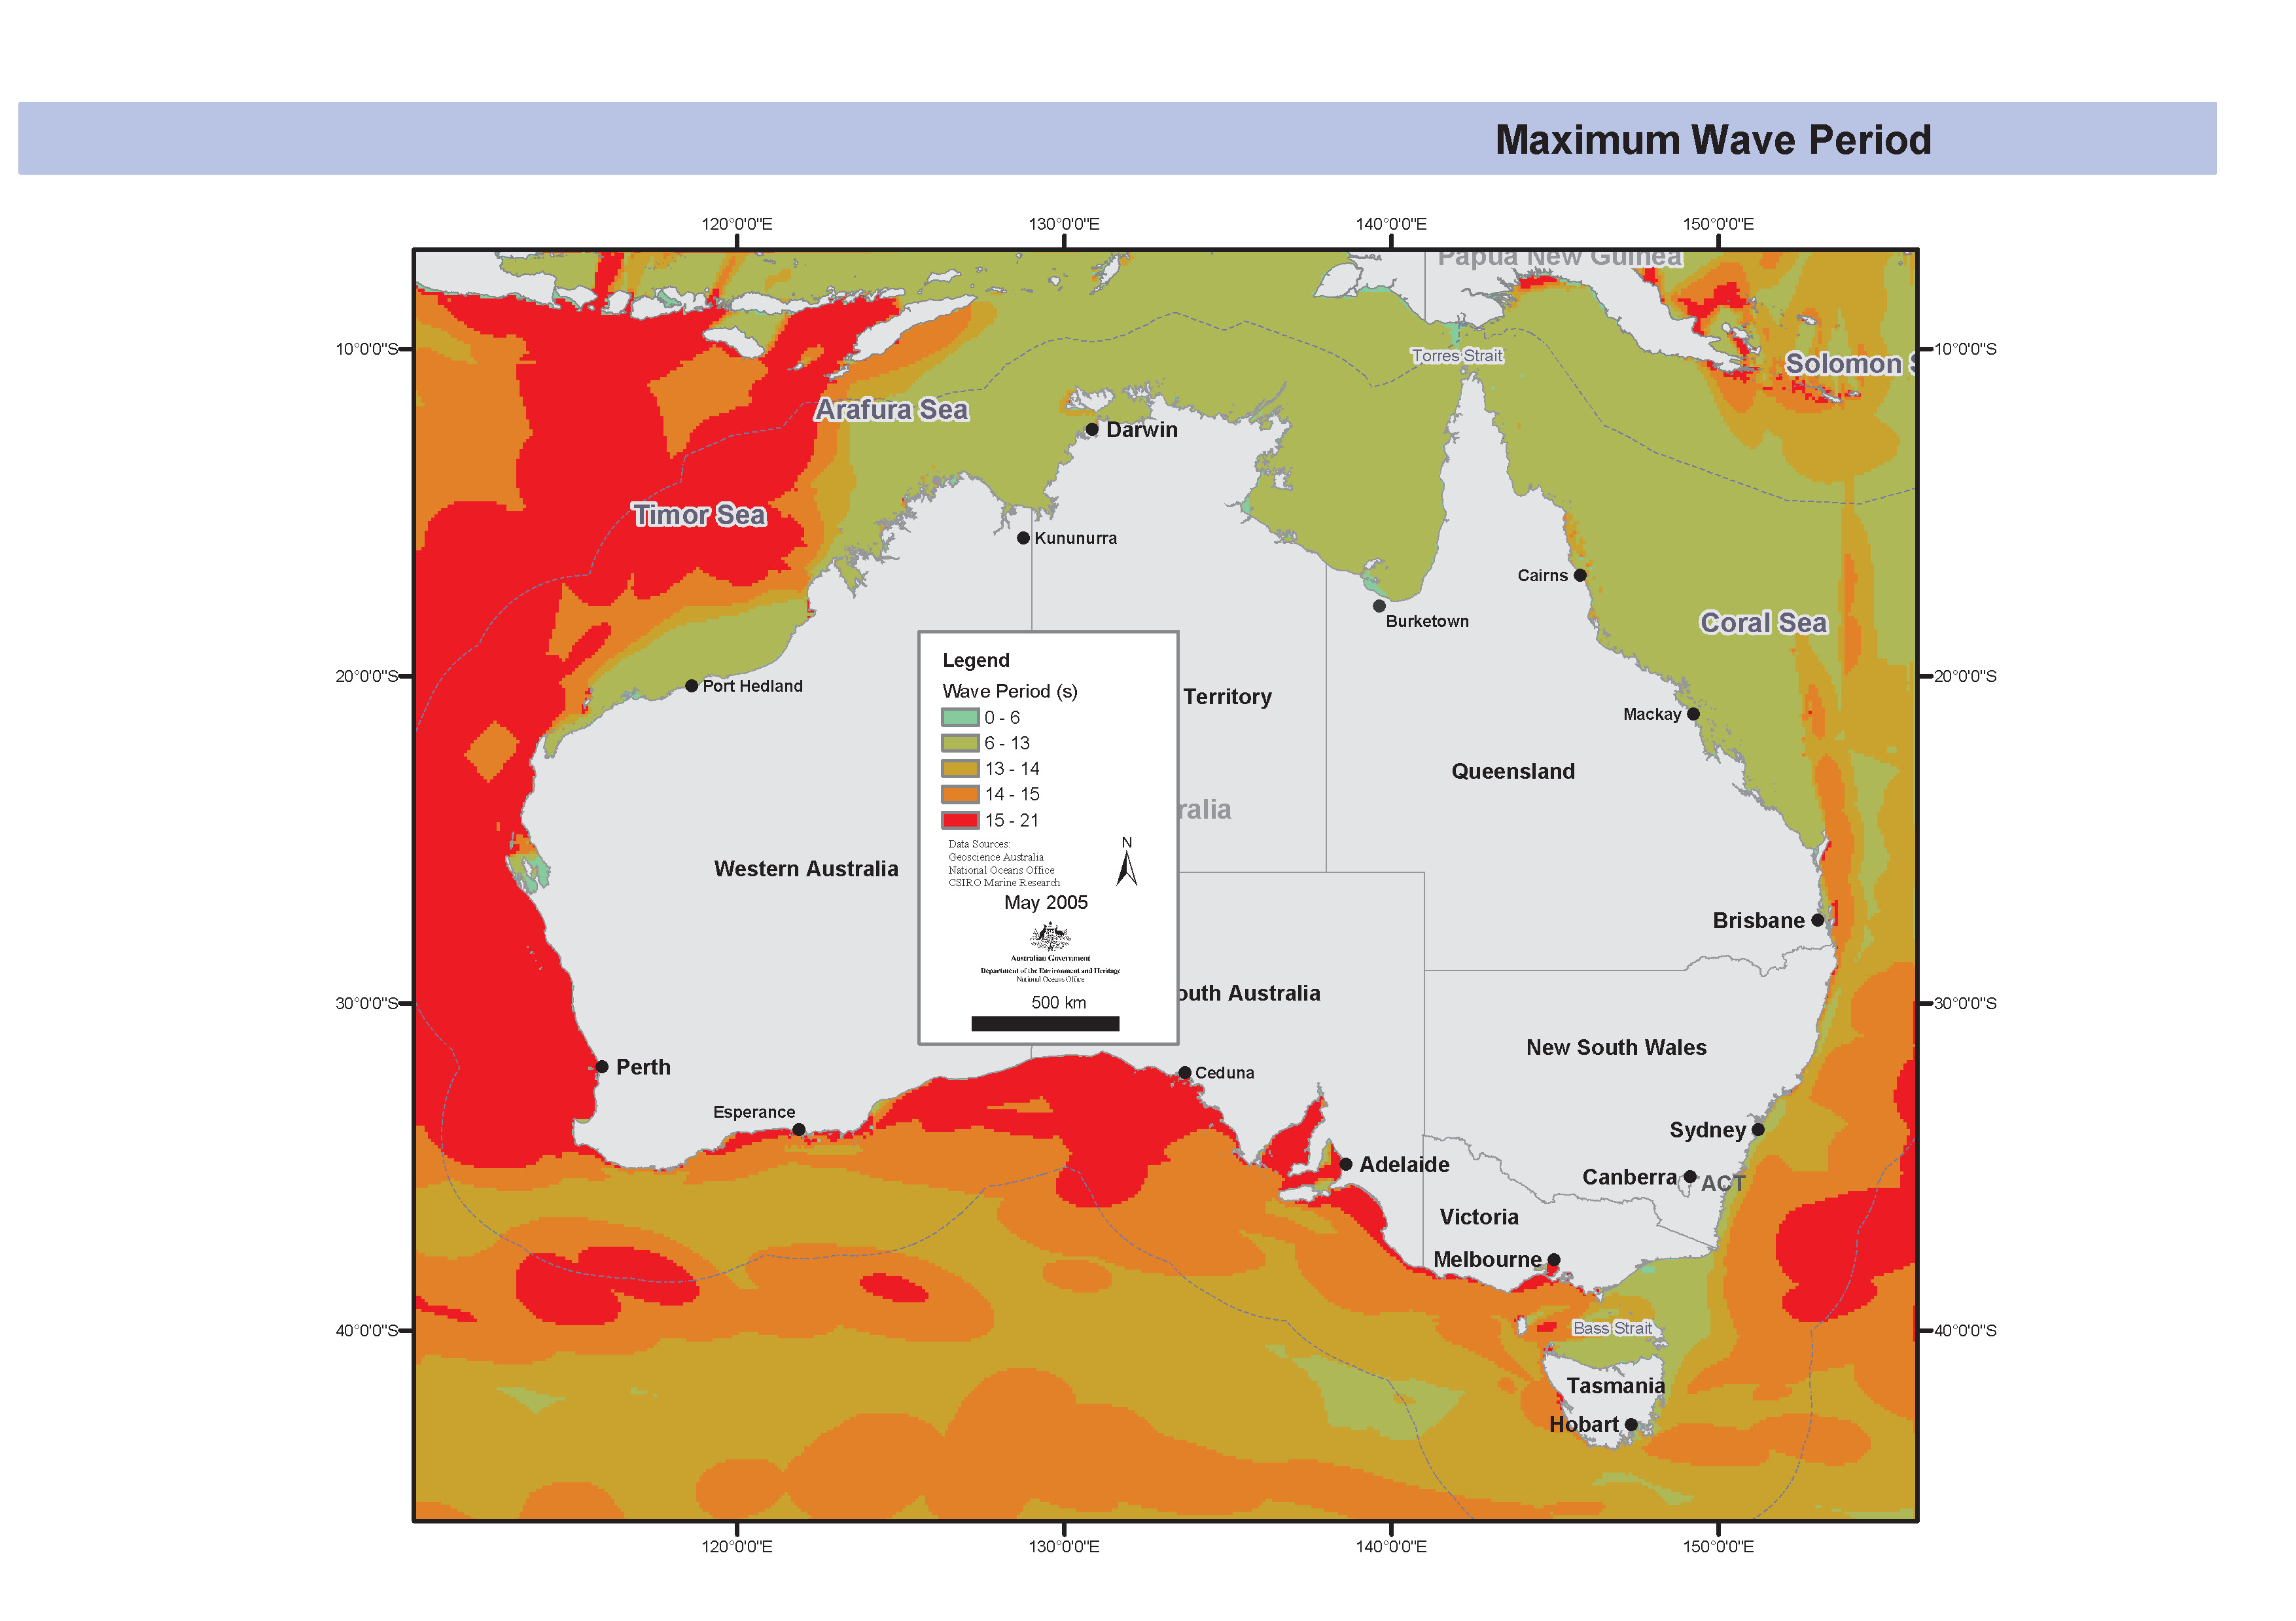
Map showing the annual maximum wave period using satellite derived wave height data generated from the Australian Bureau of Meteorology's Wave Model (WAM). This map has been produced by CSIRO for the National Oceans Office, as part of an ongoing commitment to natural resource planning and management through the 'National Marine Bioregionalisation' project. Variations in onscreen colour representation or printed reproduction may affect perception of the contained data.
-
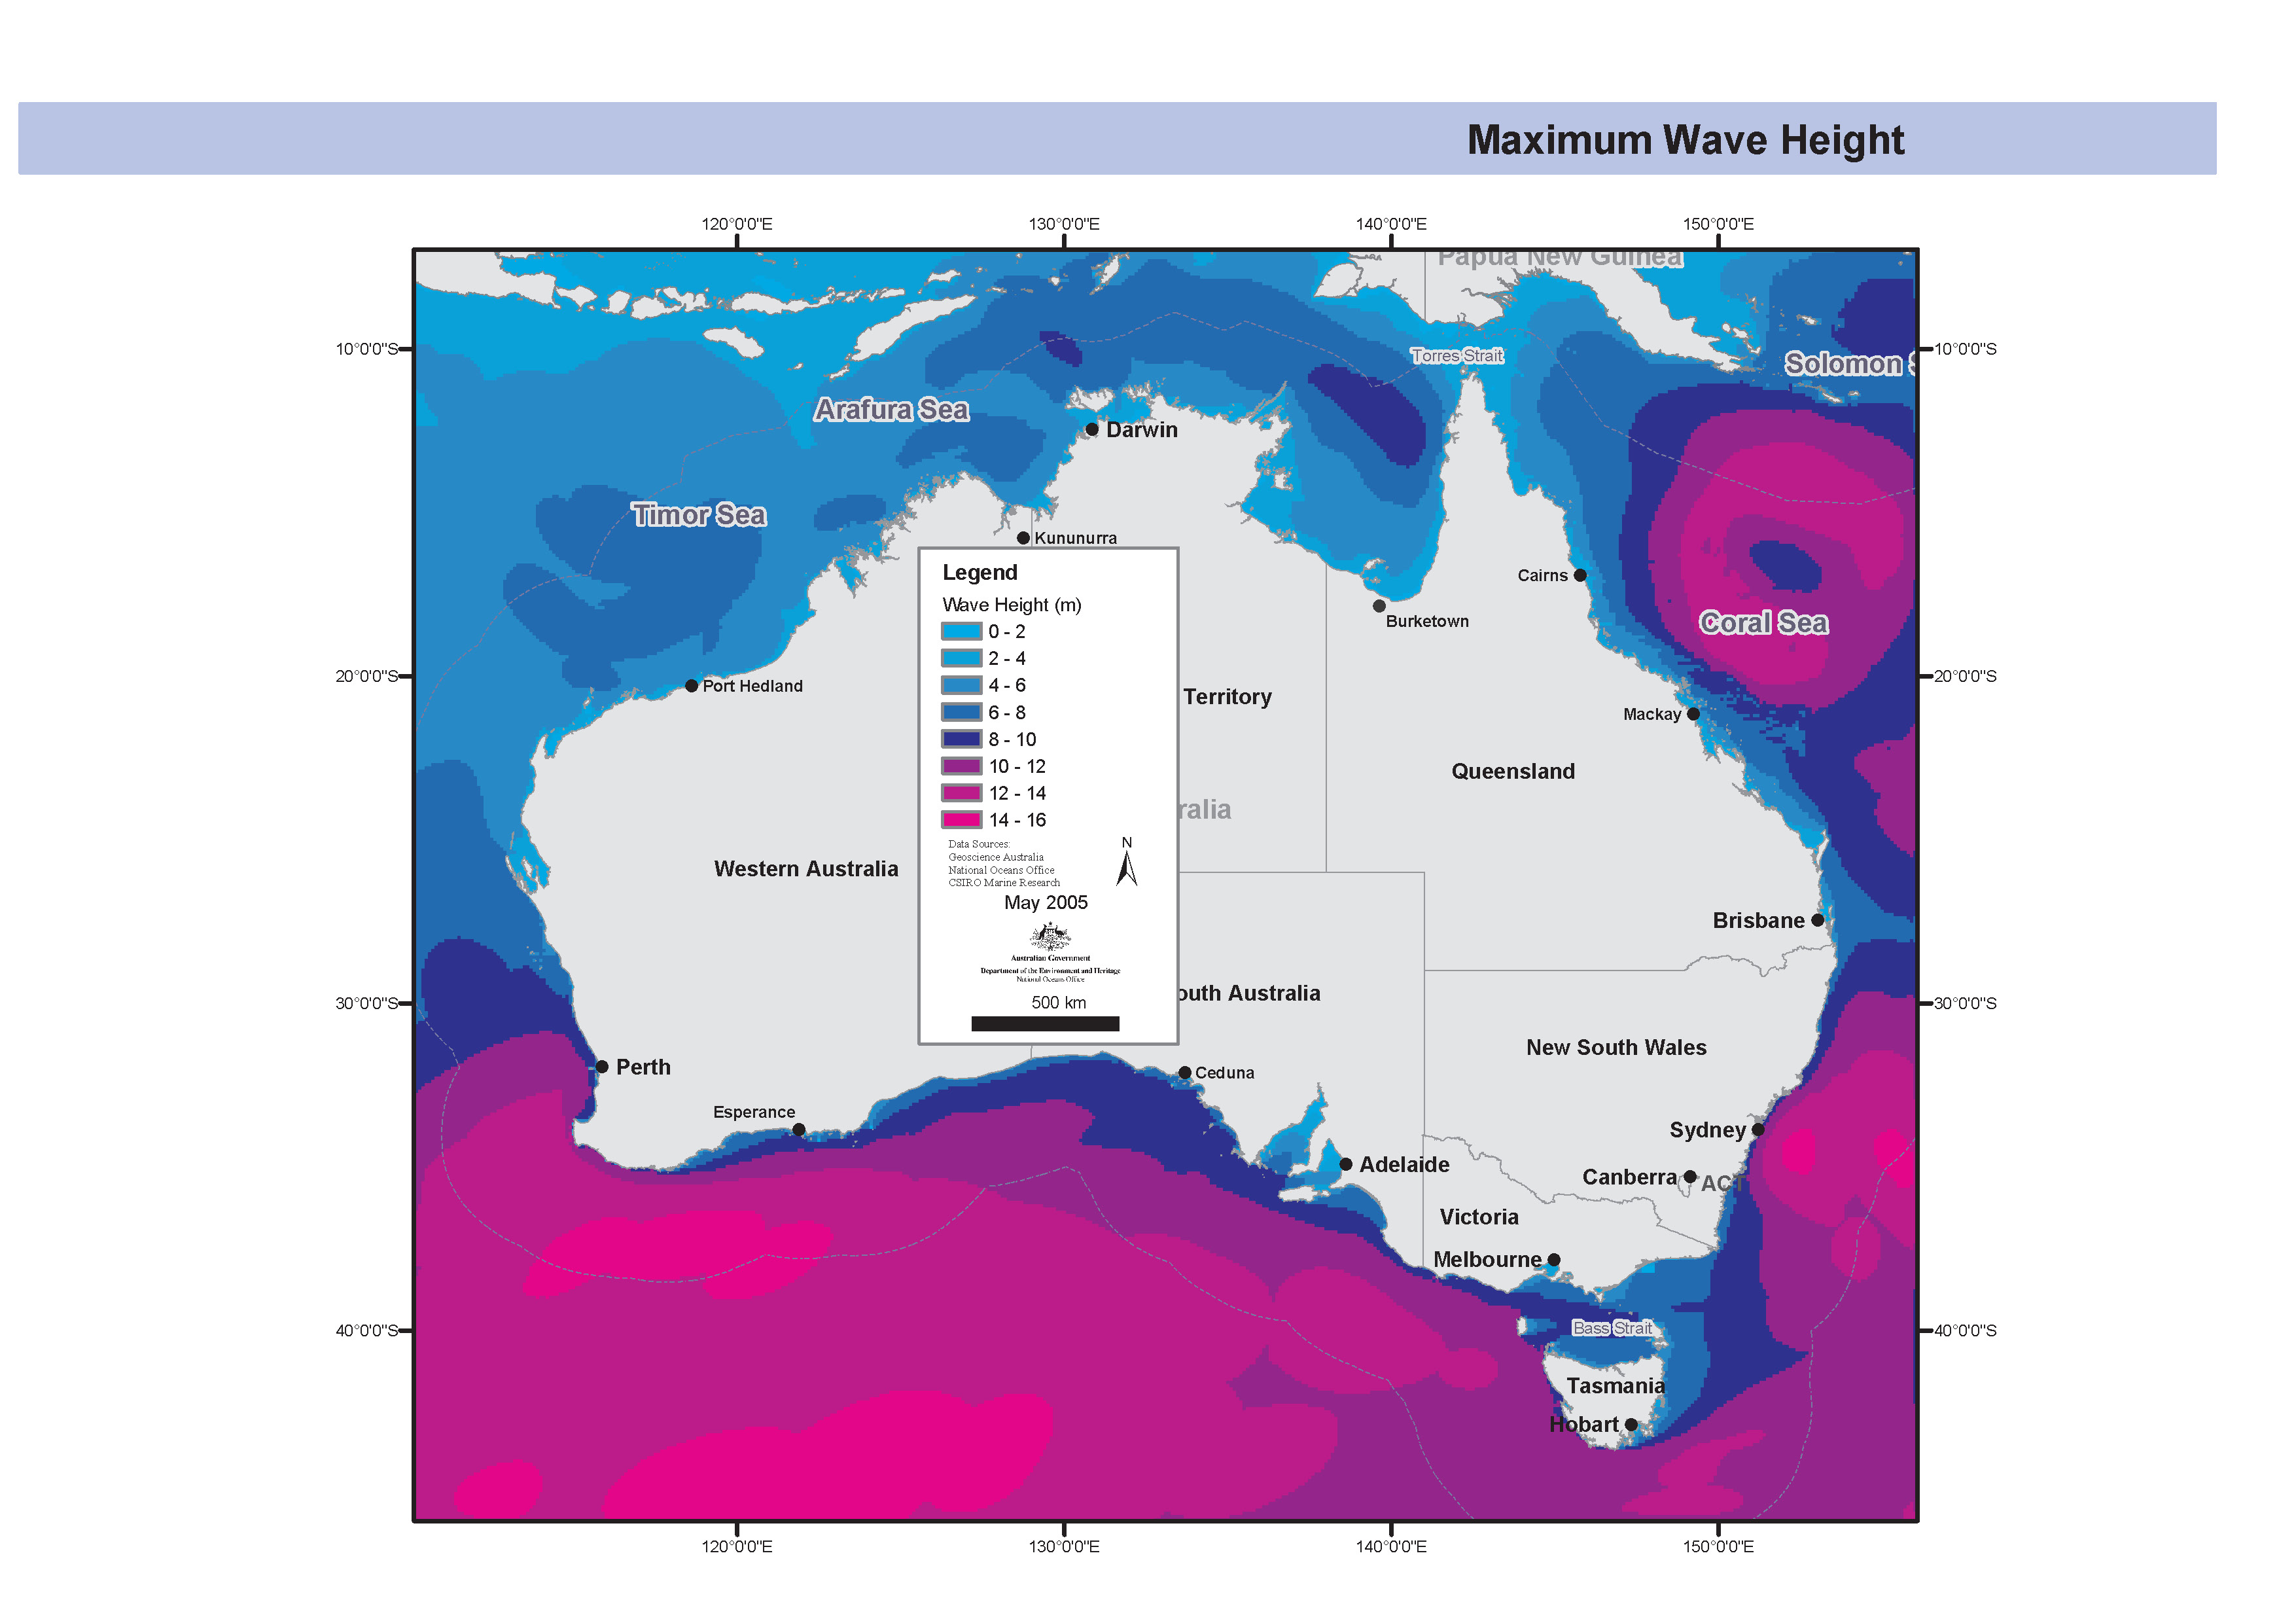
Map showing the annual maximum wave height using satellite derived wave height data generated from the Australian Bureau of Meteorology's Wave Model (WAM). This map has been produced by CSIRO for the National Oceans Office, as part of an ongoing commitment to natural resource planning and management through the 'National Marine Bioregionalisation' project. Variations in onscreen colour representation or printed reproduction may affect perception of the contained data.